29 December 2023: 2023 has been a great year for stock returns. The S&P 500 is up 25.9% in 2023, including dividend payments. But the rally could hit a hiccup in January, as the first month of the year is typically one of the worst-performing.
According to Trading.biz analyst Cory Mitchell, “If there are two months of the year to avoid, based on historical performance, it is January and September. If adding in a third month to avoid, make it June.”
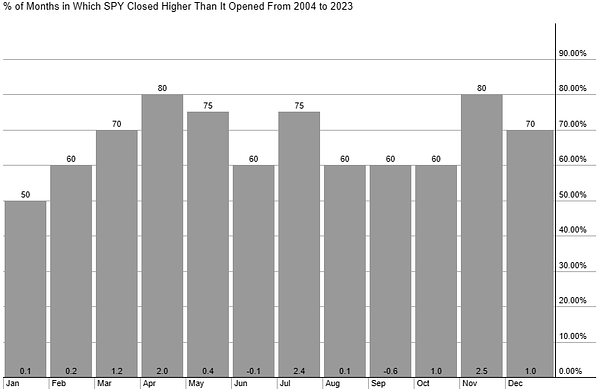
Over the last 20 years, the S&P 500 has only moved higher in January 50% of the time, or 10 years of out 20. That is the lowest of any month. Several other months—February, June, August, September, and October— have moved up 60% of the time (12 of the last 20 years). Other months move up more often.
Despite that January is a coin flip as to whether the S&P 500 will move higher or not, the average gain for the month over the last two decades is 0.1%. That is partially due to the very strong January in 2023 where the S&P 500 rose nearly 7%. From 2003 to 2022, January averaged a return of -0.4% and only rallied 9 out of 20 years (45%).
This indicates January is historically a tougher month for stocks, following the typically stronger months of November of December.
The sluggishness or pullback in January is typically followed by more bullish behavior in February, March, and April.
April is one of the best months of the year for stocks.
The following chart from StockCharts shows how the SPDR S&P 500 ETF Trust (SPY) has performed in each month over the last 20 years. The number at the top of the column is how often the price has moved in that month (percentage). The number at the bottom of the column is the average return for the month.
The chart reveals the best and worst months for stocks:
Five Months Most Likely to Rally:
March
April
May (rallies often, but lower average return than October and December, which are also decent months for stocks)
July
November
Five Worst Months:
January
February
June
August
September
Utilizing Seasonality in Stock Trading
The study of monthly stock performance, also called seasonality, is based on historical data. What happens this year is unknown. Prices could continue to rally as they have in December, but history indicates that a pullback is just as likely.
Seasonality is generally not relied on exclusively to make trading decisions, but is rather combined with other analysis methods such as price action or trend analysis.
Overall, the stock market remains in an uptrend following the 2022 October bottom, with the S&P 500 edging closer to all-time highs (excluding dividends).

+ There are no comments
Add yours